 |
||||
  |
    |
|||
|
||||
|
Symptoms ... I've been having seemingly random system slowdowns for
over a month now. This is on my main system, the one I do day to day
work on, so it is really quite important it perform well. Running
various monitoring utilities, I've discovered the following
symptoms: There were times I would see the problem, know I was transferring a lot of data to another machine on my local network, would stop the copy and watch my performance return to normal. The NIC is a built-in motherboard on a DP43TF Intel Desktop board. I'd recently updated the drivers for the board and my first rule is always "If you make a change and see a problem, undo the change and see if the problem goes away." Unfortunately, I hadn't documented the previous version ... so various drivers were tried, many parameters on the driver tweaked, and in every case the problem would recur sometime in the next few days. What I knew for certain: This wasn't a CPU issue even though one core was maxed out. When batch processing lots of photos in Canon's Digital Photo Professional, all 4 cores get railed and during those times my mouse movement was fluid like it should have been. It seemed interrupt related. Recently (2/6/2015), while I was
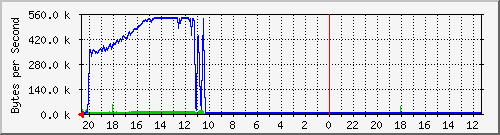
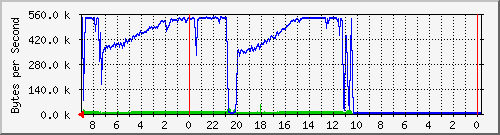
transferring a lot of data to an off-site facility, I noticed this
This is a traffic graph - I'm transferring off my network (blue line) and noticed the traffic gradually slowing down. It is going over the WAN, and my local network speed blows Comcast out of the water, so it isn't a "Too much bandwidth taken on the network" issue. I'd been playing around with various parameters on my NIC, specifically trying to get it to not be so interrupt heavy as I noticed in Process Explorer my interrupt time was at 100% of one core of the quad core CPU. Not having any luck with the NIC's
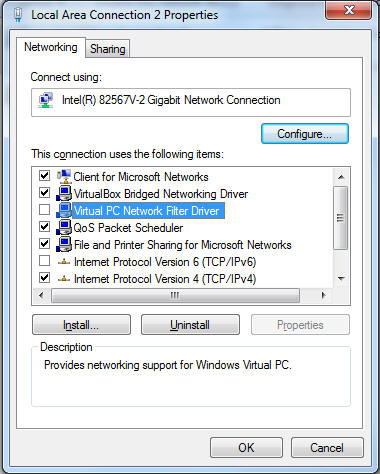
drivers, I looked at the network bindings and found something I felt was
a real possibility -
Many moons ago I ran Virtual PC, and when I needed to
plug USB devices into the virtual machine and couldn't, I switched to
Oracle's Virtual Box and never looked back.... however, I neglected to
unbind the network driver - "Virtual PC Network Filter Driver" from the
data path. So a day before what inspired me to write this up, I unbound
the filter driver, saw my performance return to normal without a reboot,
and was cautiously optimistic.
This shows the counters right now, long after I think I killed the problem. But when I saw the slowdown, I did notice the counters summed up to around 16 GB ... This time I tried unbinding IPv6 from the NIC. My goal
was not to unbind IPv6 but to reset the counters and see if the problem
went away, and while the network
settings were redoing themselves a miracle happened.
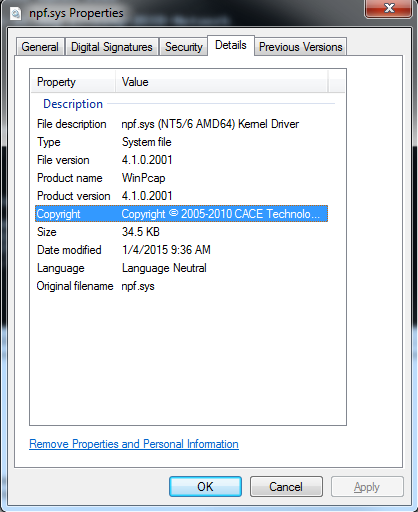
I use Netgear's Genie because it lets me print from the iPhone or iPad directly to the printer… so I’m thinking I have an older version of the npf.sys from genie that isn’t as current as wireshark wants it to be. And sure enough, looking in my installed programs:
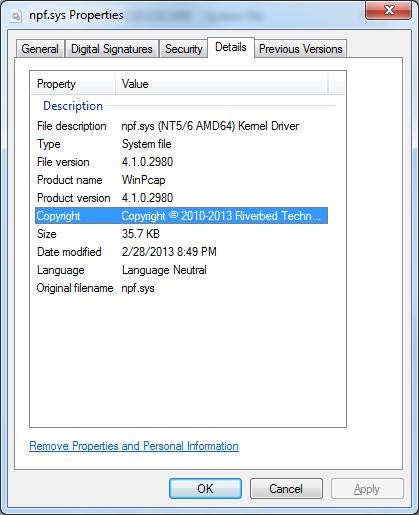
That was the date I installed Netgear's Genie! Source of the old driver located. So I figured if I update with a newer npf.sys driver I might be OK - I had an older Wireshark on my system and needed to update it anyway. With a new wireshark and winpcap installed, now npf.sys is at version 4.1.0.2980:
and back to what I was doing to see if this problem recurs or not. I've got a really good feeling though! I woke the next morning to see this graph:
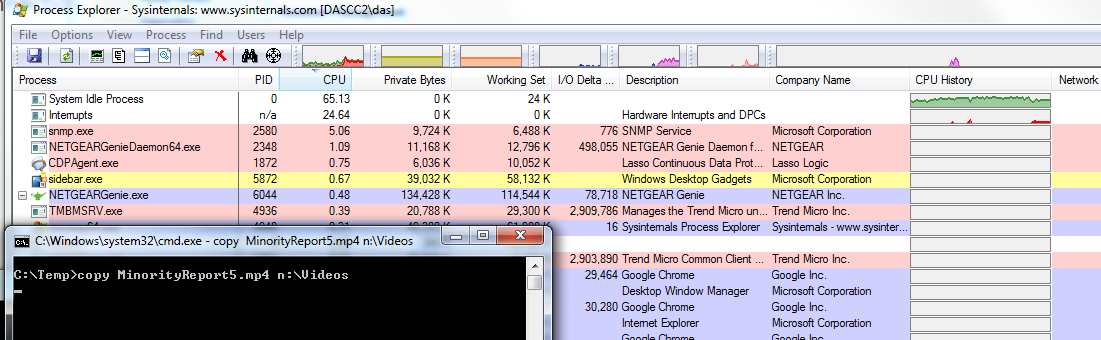
HOWEVER ... Look carefully, both processes started slowing down their performance after 5 hours ... Could be a coincidence ... Having correlated the install of Netgear's Genie with the driver, hearing someone else say that driver was their problem as well, updating the driver on my system and still having the problem ... my next step was to kill Netgear's Genie. There are three parts to it, shown here as snips from Process Explorer:
I killed both the NETGEARGenie.exe and NETGEARGenieDaemon64.exe processes and watched my performance return to normal ... without resetting anything on the network stack. You will have to use your imagination to splice these two graphs together... or maybe I'll do it in Photoshop. Not sure right now.
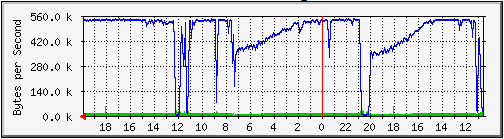
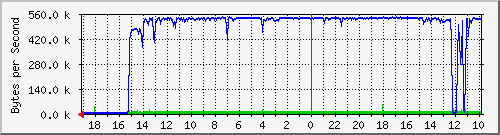
Right to left, my copy is running, at 20:00 is my blue screen crash, then performance OK for 5-ish hours after the driver update, then starts to slow down around 2 AM... 7 AM I wake, kill NetGenie, and then good traffic all the way to 20:00 (8 PM). The drops you see around 11 AM and 12 PM are the process not finding any data to transfer, not anything slowing down. That path continues here: Here is my latest graph, on the right is Sunday 10 AM and the left is the process finishing up at 15:15 on Monday:
Solid good traffic the whole day long! And that main system was in use the whole day from 5:00 AM until I stopped working around 4:30 PM - no jerky mouse movements at all. Clean and pristine, like it should have been. And what changed? I'd killed Netgear's genie program. This is the about box from the version I was running: Netgear Genie 2.3.1.46:
There is a newer version - did they fix this? Who knows - I can't find any change log documentation on Genie, information on what was fixed in different versions and what known issues there are... so one has to experiment and find out. I tried transferring a lot of data over the LAN and the slowdown does not appear to be amount of traffic related, so I'm guessing it is more a time based than traffic based problem. 2/13/2015: More Evidence! With the results above, I did an upgrade to the latest Genie 2.3.1.57:
I was busy with other projects for a couple of days, patch Tuesday came and rebooted my machine resetting the clock so it took a few days to give me an answer ... and guess what? The mouse stuttering problem is back whenever there is any minor network traffic ... and system becomes unresponsive when I transfer a large amount of data. I captured some graphs before and after killing Netgear Genie. These are thumbnail images - click to see a full-screen version. Before:
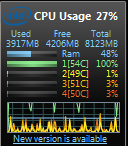
I'm copying a video across the network, Interrupts are pegged at 25%. Netgear's genie isn't exactly hogging the CPU, but clearly whatever he is doing is causing problems in the rest of the system. Here is a graph showing the activity on each core along with a short history (it is a gadget on the windows 7 sidebar you can find here):
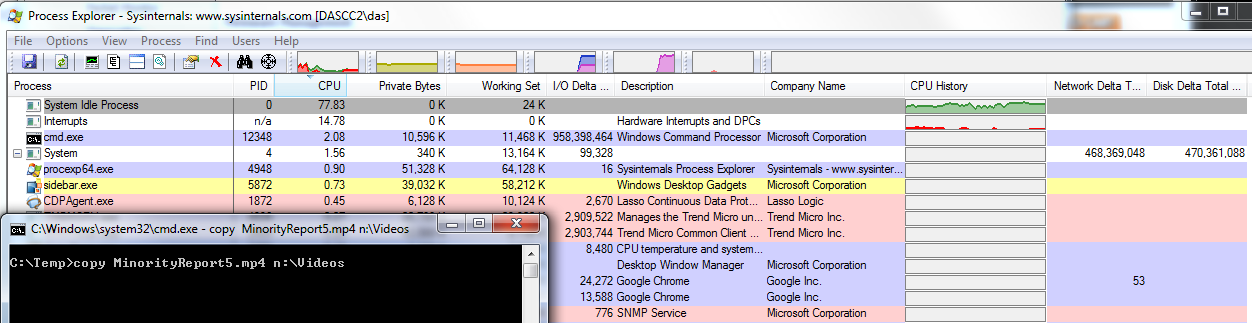
While the CPU isn't pegged, one core is. That core must be handling interrupts, because it took many minutes of patient mouse movement & waiting for the screen mouse to catch up to capture these print screens. So I killed both these processes: NETGEARGenieDaemon64.exe and NETGEARGenie.exe. The first didn't let my system go, but killing the second freeed it up. Now I repeated the same copy and here are the same two print screens:
For the curiously observent, you can see the cmd.exe prompt that is doing the copy now registers up on the CPU graph, as does his I/O Delta - so he is now copying the data much faster than he did while Genie was sucking the life out of the system. In fact, the copy happend so fast the copy finished before gadget CPU graph plotted a full width!
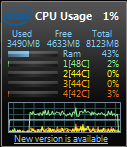
Compare the green graph that is here up around 70% VS. the green that was pegged at 100% when netgear genie was running. Conclusion: For now, I've stuffed the Netgear Genie back into its bottle. It is now uninstalled from my system, and I'm removing it from any client systems. Netgear didn't fix it with the new version. I can't even find a support BBS to post these results to. But by far the biggest indicator that we are all hitting the exact same bug is this: npf+2b81 - this is the address offset into the npf driver. If we are all crashing in the same driver's code at the same location, then we are all experiencing the exact same bug. Final Words... I can be reached at: Endnotes: There is nothing really useful here - mostly stuff for any wandering search engines to find the content. Here is a full copy of the crashdump analysis as done by windbg.exe: Microsoft (R) Windows Debugger Version
6.12.0002.633 AMD64 Copyright (c) Microsoft Corporation. All rights
reserved. Loading Dump File
[C:\Temp\BSOD-Network\020715-11466-01.dmp] Mini Kernel Dump File: Only registers and stack
trace are available Symbol search path is: symsrv*symsrv.dll*c:\symbols*http://msdl.microsoft.com/download/symbols Executable search path is: Windows 7 Kernel Version 7601 (Service Pack 1) MP
(4 procs) Free x64 Product: WinNt, suite: TerminalServer
SingleUserTS Built by:
7601.18700.amd64fre.win7sp1_gdr.141211-1742 Machine Name: Kernel base = 0xfffff800`03c63000
PsLoadedModuleList = 0xfffff800`03ea6890 Debug session time: Sat Feb 7 20:03:14.197
2015 (UTC - 5:00) System Uptime: 1 days 7:14:07.941 Loading Kernel Symbols
...............................................................
................................................................
............................................................. Loading User Symbols Loading unloaded module list .................
******************************************************************************* *
* *
Bugcheck Analysis
* *
*
******************************************************************************* Use !analyze -v to get detailed debugging
information. BugCheck A, {fffffa802de07178, 2, 1,
fffff80003ce2fe5} Unable to load image npf.sys, Win32 error 0n2 *** WARNING: Unable to verify timestamp for
npf.sys *** ERROR: Module load completed but symbols
could not be loaded for npf.sys Probably caused by : npf.sys ( npf+2b81 ) Followup: MachineOwner --------- 3: kd> !analyze -v
******************************************************************************* *
* *
Bugcheck Analysis
* *
*
******************************************************************************* IRQL_NOT_LESS_OR_EQUAL (a) An attempt was made to access a pageable (or
completely invalid) address at an interrupt request level (IRQL) that is too high.
This is usually caused by drivers using improper addresses. If a kernel debugger is available get the stack
backtrace. Arguments: Arg1: fffffa802de07178, memory referenced Arg2: 0000000000000002, IRQL Arg3: 0000000000000001, bitfield :
bit 0 : value 0 = read operation, 1 = write operation
bit 3 : value 0 = not an execute operation, 1 = execute operation (only
on chips which support this level of status) Arg4: fffff80003ce2fe5, address which referenced
memory Debugging Details: ------------------ WRITE_ADDRESS: GetPointerFromAddress: unable to
read from fffff80003f10100 fffffa802de07178 CURRENT_IRQL: 2 FAULTING_IP: nt!KeAcquireSpinLockRaiseToDpc+55 fffff800`03ce2fe5 f0480fba2900
lock bts qword ptr [rcx],0 CUSTOMER_CRASH_COUNT: 1 DEFAULT_BUCKET_ID: VISTA_DRIVER_FAULT BUGCHECK_STR: 0xA PROCESS_NAME: dllhost.exe TRAP_FRAME: fffff8800edf1e80 -- (.trap
0xfffff8800edf1e80) NOTE: The trap frame does not contain all
registers. Some register values may be zeroed or incorrect. rax=0000000000000002 rbx=0000000000000000
rcx=fffffa802de07178 rdx=00000000000007ff rsi=0000000000000000
rdi=0000000000000000 rip=fffff80003ce2fe5 rsp=fffff8800edf2010
rbp=fffffa802de07178 r8=fffffa80215c33b8 r9=0000000000000000
r10=fffffffffffffff7 r11=00000000002f4e00 r12=0000000000000000
r13=0000000000000000 r14=0000000000000000 r15=0000000000000000 iopl=0
nv up ei pl nz na pe nc nt!KeAcquireSpinLockRaiseToDpc+0x55: fffff800`03ce2fe5 f0480fba2900
lock bts qword ptr [rcx],0 ds:2070:fffffa80`2de07178=???????????????? Resetting default scope LAST_CONTROL_TRANSFER: from
fffff80003cd9429 to fffff80003cd9e80 STACK_TEXT: fffff880`0edf1d38 fffff800`03cd9429 :
00000000`0000000a fffffa80`2de07178 00000000`00000002 00000000`00000001
: nt!KeBugCheckEx fffff880`0edf1d40 fffff800`03cd80a0 :
fffff880`014e7100 fffff880`014eacb0 fffff880`014ead20 00000000`00000000
: nt!KiBugCheckDispatch+0x69 fffff880`0edf1e80 fffff800`03ce2fe5 :
00000000`00000000 fffff880`014905b2 00000000`c0000000 fffffa80`00000000
: nt!KiPageFault+0x260 fffff880`0edf2010 fffff880`05ca6b81 :
00000000`00000001 fffffa80`08a261c0 fffffa80`0939d010 fffffa80`2de04000
: nt!KeAcquireSpinLockRaiseToDpc+0x55 fffff880`0edf2060 00000000`00000001 :
fffffa80`08a261c0 fffffa80`0939d010 fffffa80`2de04000 00000000`00060000
: npf+0x2b81 fffff880`0edf2068 fffffa80`08a261c0 :
fffffa80`0939d010 fffffa80`2de04000 00000000`00060000 fffff880`0edf2088
: 0x1 fffff880`0edf2070 fffffa80`0939d010 :
fffffa80`2de04000 00000000`00060000 fffff880`0edf2088 fffff880`0edf2088
: 0xfffffa80`08a261c0 fffff880`0edf2078 fffffa80`2de04000 :
00000000`00060000 fffff880`0edf2088 fffff880`0edf2088 00000000`00000000
: 0xfffffa80`0939d010 fffff880`0edf2080 00000000`00060000 :
fffff880`0edf2088 fffff880`0edf2088 00000000`00000000 fffffa80`0939d010
: 0xfffffa80`2de04000 fffff880`0edf2088 fffff880`0edf2088 :
fffff880`0edf2088 00000000`00000000 fffffa80`0939d010 fffff880`0152b38b
: 0x60000 fffff880`0edf2090 fffff880`0edf2088 :
00000000`00000000 fffffa80`0939d010 fffff880`0152b38b fffffa80`0a5932d0
: 0xfffff880`0edf2088 fffff880`0edf2098 00000000`00000000 :
fffffa80`0939d010 fffff880`0152b38b fffffa80`0a5932d0 fffffa80`0a5932d0
: 0xfffff880`0edf2088 STACK_COMMAND: kb FOLLOWUP_IP: npf+2b81 fffff880`05ca6b81 ??
??? SYMBOL_STACK_INDEX: 4 SYMBOL_NAME: npf+2b81 FOLLOWUP_NAME: MachineOwner MODULE_NAME: npf IMAGE_NAME: npf.sys DEBUG_FLR_IMAGE_TIMESTAMP: 4c24de72 FAILURE_BUCKET_ID: X64_0xA_npf+2b81 BUCKET_ID: X64_0xA_npf+2b81 Followup: MachineOwner --------- 3: kd> lmvm npf start
end
module name fffff880`05ca4000 fffff880`05cb0000
npf T (no symbols) Loaded symbol image file: npf.sys Image path: npf.sys Image name: npf.sys Timestamp:
Fri Jun 25 12:50:58 2010 (4C24DE72) CheckSum:
00011844 ImageSize:
0000C000 Translations:
0000.04b0 0000.04e4 0409.04b0 0409.04e4 |
||||